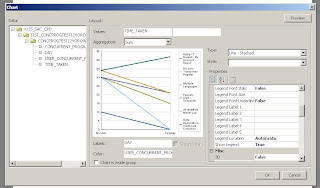
Another request to get crosstab total in BI Publisher from forum.
Forum post
Just we need to map the column and row in old way.
Note: this is crosstab and latest BIP has the functionality of PIVOT table, which is more powerful than this.

Monday, November 09, 2009
BI Publisher CrosstabTotal
Posted by Vetriselvan at 9:45 PM 0 comments Links to this post
Labels: cross tab
Tuesday, October 27, 2009
sum total column in BIP pivot table
For long long time, wanted to document this , but missed in my list.
In BIP 10.1.3.4 ++, new support was added to the crosstab and changed it to pivot table.
In order to use this functionality, the server has to be in latest or above 10.1.3.4++.
Reason: server support has been added to make it much better.
How does it work.
Forum question
<?crosstab:c45;"//ROW";"CodPais{,o=a,t=t}";"Pais{,o=a,t=t}";"Hombre,Mujer";"sum"?>
And use following in total,
<?$c45//M0/M1/T?> == Hombre
<?$c45//M0/M2/T?> == Mujer
c45 -- refers to the name of the table
R - refers to ROW
C - refers to column
o=a ==> order - ascending
t=t ==> datatype = text
"sum" ==> specifies the summary, you can use count, sum etc...
$c45//M0/M1/T - sum of Hombre element
$c45//M0/M2/T - sum of Mujer element
Posted by Vetriselvan at 9:25 PM 0 comments Links to this post
Labels: cross tab
PIE chart - Explode slice
In the pie chart,
how to seperate the slices.
if there is a support to for a way to separate the slices in pie chart was the question in the forum.
Answer to this is a big YES :)
In order to "explode" pie slices, add the following lines in the "Graph Settings" under the graph element.
<SeriesItems>
<Series id="0" pieSliceExplode="100"/>
<Series id="1" pieSliceExplode="100"/>
<Series id="2" pieSliceExplode="100"/>
<Series id="3" pieSliceExplode="100"/>
</SeriesItems>
<Graph ...... pieDepth="25" pieTilt="25" ....> add this to your graph element attribute , to tilt the pie slices
Posted by Vetriselvan at 9:19 PM 0 comments Links to this post
Labels: BI Publisher, chart
Custom Scalefactor
By default the Y or X -axis scale in my graph reads as 0K, 20K, 40K...
How to modify the scale to read 10000, 20000... or in some other custom formats?
<Y1Axis>
<ViewFormat scaleFactorUsed="true" scaleFactor="SCALEFACTOR_NONE" />
</Y1Axis>
Attribute scale factor can take one of the following values.
SCALEFACTOR_THOUSANDS | SCALEFACTOR_MILLIONS | SCALEFACTOR_BILLIONS | SCALEFACTOR_TRILLIONS | SCALEFACTOR_QUADRILLIONS
Posted by Vetriselvan at 9:13 PM 0 comments Links to this post
Labels: BI Publisher, BIP, chart
Tuesday, October 20, 2009
Power of Inlines
How to add the looping element in same line - horizontally ?
use @inlines command,in conjunction with for-each.
Here is the sample on how to do.
Posted by Vetriselvan at 8:28 PM 0 comments Links to this post
Labels: BI Publisher, BIP, Bip looping, inlines
Friday, October 16, 2009
subtemplating
Have a look at this,
just adding sub template and calling them based on the concurrent program parameter.
<?param@begin:ReportType;string(‘YS’)?>
<?choose:?>
<?when: $ReportType =’YES’?>
<?call:TC1?>
<?end when?>
<?when: $ReportType =’NO’?>
<?call:TC2?>
<?end when?>
<?otherwise:?>
<?call:TC2?>
<?end otherwise?>
<?end choose?>
Run with ReportType as NO or other than YES.
You should get the result as follows
Run with ReportType YES.
You should get the result as follows
Posted by Vetriselvan at 11:08 AM 2 comments Links to this post
Labels: Grouping, subtemplate