Posts

Showing posts with the label cross tab

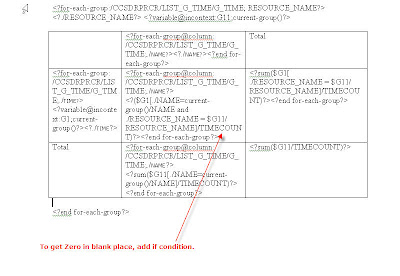
Another Crosstab total

Image
Probably, it will look like duplicate entry of http://winrichman.blogspot.com/2009/09/cross-tab-summation-in-rtf.html This was a request from another user , he was interested in seeing the results on his xml data. here it is.

Split List in to Multi-Column

Image
Ooops, this turning out be an example needed for each query i get. Neway, i enjoy answering them. Consider this request, you have list, but you dont want to put in one below other. Rather, 4 in a row, or consider X in a row and rest X of them in next line and goes on. You can do it in many ways. First simple one would be have multiple for-each stmt's in each column. Add a filter on mod, 1,2,3,4,...0 Note: 0 is on the last column. Have a look at the snapshots, it is self-explanatory, i guess.

BI Publisher CrosstabTotal

Image
Another request to get crosstab total in BI Publisher from forum. Forum post Just we need to map the column and row in old way. Note: this is crosstab and latest BIP has the functionality of PIVOT table, which is more powerful than this.

sum total column in BIP pivot table

For long long time, wanted to document this , but missed in my list. In BIP 10.1.3.4 ++, new support was added to the crosstab and changed it to pivot table. In order to use this functionality, the server has to be in latest or above 10.1.3.4++. Reason: server support has been added to make it much better. How does it work. Forum question <?crosstab:c45;"//ROW";"CodPais{,o=a,t=t}";"Pais{,o=a,t=t}";"Hombre,Mujer";"sum"?> And use following in total, <?$c45//M0/M1/T?> == Hombre <?$c45//M0/M2/T?> == Mujer c45 -- refers to the name of the table R - refers to ROW C - refers to column o=a ==> order - ascending t=t ==> datatype = text "sum" ==> specifies the summary, you can use count, sum etc... $c45//M0/M1/T - sum of Hombre element $c45//M0/M2/T - sum of Mujer element

Cross tab Summation in RTF

Image
Crosstab report. It can be done in many ways, ideally people love to take some granular level data and manipulate and apply that in different template. Advantage of granular level data : We can use it for some other RTF template. We can show that the way we need to. If you pre-group, then your report will be faster. But you use the flex of using the same data for showing it different layout. since you pre-grouped it, its fixed data for some layout. You use this flex here. its a trade off on flex or performance, i choose go on the balanced line of these two. Forums thread with issue 1. it should be pretty simple in BIP template too. 2. have a look the thread link , i answered how to do it in Datatemplate. 3. Db rollup is also good option but for the answer at OPTION 1 look at this picture.

Cross tab, by limiting the number of colums

Image
Cross-tab is the report, when the number of columns are unknown. But if the columns exceeds the page, the rest of the columns are moved to next page, by default. Horizontal-table-break command will be helpful here to repeat the number of columns to the next page. But if we want to control the number of columns that is displayed and if it exceeds the certain number, then the table has to be created in the same page from the columns where it left. In case there are 6 columns going accross (columns going accross are dynamic...). the first 5 columns should be displayed in one table and next 1 in another table below the first table In case of there are 16 columns going across.. 1st five columns in first table, 2nd five columns in 2nd table below the first table, 3rd five columns in third table below the 2nd table and remaining one column in the fourth table below the 3rd table is it possible ? Yes it is possible :) Here it is.

Data across in Bi publisher

Image
To get the cross tab. 1. we need to find the number of columns to be displayed. 2. what is the element to be mapped as column ? 3. then create a table. 4. the first row of the table , we need to specify the colum heading. so use the @column command 5. then in the rest of the row where you wanted to display the value , use @cell command

Hide column from the crosstab report

In crosstab or dynamic column report , we typically do the following. <?for-each-group@column:ROW;./FISCAL_YEAR?> If i have to filter out particular value from being generated from the dynamic columns or crosstab report. <?for-each-group@column:ROW[./FISCAL_YEAR !='2000'];./FISCAL_YEAR?>

Crosstab issue

Image
http://forums.oracle.com/forums/thread.jspa?messageID=3344649 In order to get the all months,the for-each should have been put on the whole xml, rather than , the current group. the current group might be missing some month value in the xml.

Dynamic Column

Image
Dynamically create the column based on the no of element in the XML. Here is the sample of, how 2 do that. 1. first table contains, DATA as parent node, which contains 6 columns , so in the o/p we get 6 dynamic columns 2. in the second table, the THREECOLUMNDATA node contains, 3 elements, so is the output too   Winrichman.blogspot.com

Crosstab with multiple repeating columns

Image
How to create a crosstab with two repeating columns.? Here i have taken a multiple column dynamic generation The loop has to be on both of these columns, so that the vlaues are displayed for each date ;)

Pivot table / Cross Table with Fixed Number of Columns

Image
In the forum http://forums.oracle.com/forums/thread.jspa?threadID=685245&tstart=0 With this data Andy was asking for fixed number of column , Thou i answered him in the forum, but , he needs to see the output and code , how to achieve that.. BIP World , would be happy , if we are able to upload rtf, image files there in forum , so that explaining things cud be easier. Never mind Oracle , can come-up with new things quickly.. here you go !

Cross Tabs problem with grouping and extra columns; possible bug?

Image
There was a question in BIP forum to get the dynamic column,.. User was Brian, he required , the number of column based on the data in the xml... This was the XML , he gave. He required this kind of output, which is obvious, but , by using the Cross-tab from the menu, and formatting , you cannot expect this output.. That is going to screw up the output. He was thinking, it is some kind of bug, its not a bug, the way he want can be done easily :). Little understanding of how report should work is required :) here is the solution :) Please click on the image to see :)