Posts

Showing posts with the label Summation In BIP

Cross tab Summation in RTF
Image
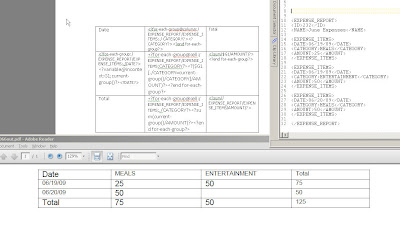
Crosstab report. It can be done in many ways, ideally people love to take some granular level data and manipulate and apply that in different template. Advantage of granular level data : We can use it for some other RTF template. We can show that the way we need to. If you pre-group, then your report will be faster. But you use the flex of using the same data for showing it different layout. since you pre-grouped it, its fixed data for some layout. You use this flex here. its a trade off on flex or performance, i choose go on the balanced line of these two. Forums thread with issue 1. it should be pretty simple in BIP template too. 2. have a look the thread link , i answered how to do it in Datatemplate. 3. Db rollup is also good option but for the answer at OPTION 1 look at this picture.

Summation of deficit data 2

Image
Again poped up, You have to use this, since you have data deficit in xml. <?xdoxslt:div(sum(current-group()[Interchange_Qual_Desc='BEST-QUAL']/Interchange_Qual_Count),/ROOT/LIST_Interchange_Tran_mc/Interchange_Tran_mc/Interchange_Tran_Count_Per_mc) * 100?> change the value, BEST, MID and NON for the three columns respectively. For the total, again <?xdoxslt:div(sum(/ROOT/LIST_Interchange_Qualilfication_Summary/Interchange_Qualilfication_Summary[Interchange_Qual_Desc='MID-QUAL']/Interchange_Qual_Count),(/ROOT/LIST_Interchange_Tran_v/Interchange_Tran_v/Interchange_Tran_Count_Per_v + /ROOT/LIST_Interchange_Tran_mc/Interchange_Tran_mc/Interchange_Tran_Count_Per_mc)) * 100?>

Summation of deficit data

Image
Request was, how to display the data when the value is not present in xml data. Just add the fixed number of description as rows and calculate respective total

Summation.

Image
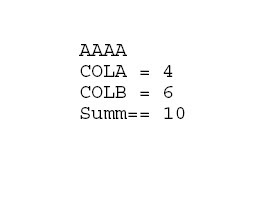
Put this code in RTF and then load the data , have a look at the output.

Sum rows in RTF Template

Image
Grouping and transforming is fun, One more question on forum Asking for Grouping differently.. This is normal grouping Output Product Name |Sales ------------------------|-------- Product A |50 ------------------------|-------- Product B |100 ------------------------|--------- Product B1 |100 ------------------------|--------- Product B2 |25 ------------------------|--------- Product C |75 But I would like a table like : Product Name |Sales ------------------------|-------- Product A |50 ------------------------|-------- Product B |100 ------------------------|--------- Others Prd B |125 ------------------------|--------- Product C |75 ------------------------|--------- Here is sol'n

Calculation In Bip

Post from Sudeep[ i guess i knew this guy :)], If i have this xml <ROOT> <T> <A1>10</A1> <B1>5</B1> </T> <T> <A1>10</A1> <B1>5</B1> </T> <T> <A1>10</A1> <B1>5</B1> </T> </ROOT> i am using this xsl , <?sum(T /A1)?> <?sum(T/B1)?> <?xdoxslt:set_variable($_XDOCTX, ‘TEST’,0)?> <?for-each:T?> <? A1*B1?> <?xdoxslt:set_variable($_XDOCTX, ‘TEST’, xdoxslt:get_variable($_XDOCTX, 'TEST')+(A1*B1))?> <?end for-each?> <? xdoxslt:get_variable($_XDOCTX, 'TEST')?> which will return me the 30 15 50 50 50 150 Got some thanks :) from sudeep too.