Multiple Line Chart in BI Publisher
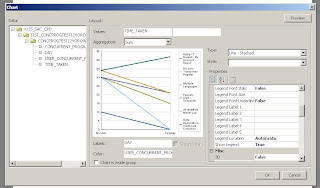
Here is a sample of how do you do Line-stacked graph. In BI Publisher menu, select chart and drag and drop the required column , do choose type of the chart as Line- Stacked. xml is available in the forum post and here it is