Posts

Showing posts from 2009

BI Publisher CrosstabTotal

Image
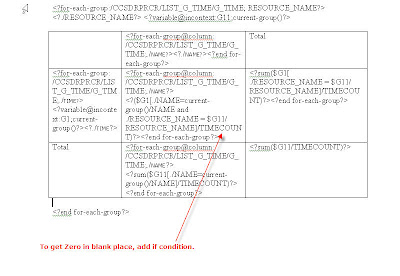
Another request to get crosstab total in BI Publisher from forum. Forum post Just we need to map the column and row in old way. Note: this is crosstab and latest BIP has the functionality of PIVOT table, which is more powerful than this.

sum total column in BIP pivot table

For long long time, wanted to document this , but missed in my list. In BIP 10.1.3.4 ++, new support was added to the crosstab and changed it to pivot table. In order to use this functionality, the server has to be in latest or above 10.1.3.4++. Reason: server support has been added to make it much better. How does it work. Forum question <?crosstab:c45;"//ROW";"CodPais{,o=a,t=t}";"Pais{,o=a,t=t}";"Hombre,Mujer";"sum"?> And use following in total, <?$c45//M0/M1/T?> == Hombre <?$c45//M0/M2/T?> == Mujer c45 -- refers to the name of the table R - refers to ROW C - refers to column o=a ==> order - ascending t=t ==> datatype = text "sum" ==> specifies the summary, you can use count, sum etc... $c45//M0/M1/T - sum of Hombre element $c45//M0/M2/T - sum of Mujer element
PIE chart - Explode slice

In the pie chart, how to seperate the slices. if there is a support to for a way to separate the slices in pie chart was the question in the forum. Answer to this is a big YES :) In order to "explode" pie slices, add the following lines in the "Graph Settings" under the graph element. <SeriesItems> <Series id="0" pieSliceExplode="100"/> <Series id="1" pieSliceExplode="100"/> <Series id="2" pieSliceExplode="100"/> <Series id="3" pieSliceExplode="100"/> </SeriesItems> <Graph ...... pieDepth="25" pieTilt="25" ....> add this to your graph element attribute , to tilt the pie slices

Custom Scalefactor

By default the Y or X -axis scale in my graph reads as 0K, 20K, 40K... How to modify the scale to read 10000, 20000... or in some other custom formats? <Y1Axis> <ViewFormat scaleFactorUsed="true" scaleFactor="SCALEFACTOR_NONE" /> </Y1Axis> Attribute scale factor can take one of the following values. SCALEFACTOR_THOUSANDS | SCALEFACTOR_MILLIONS | SCALEFACTOR_BILLIONS | SCALEFACTOR_TRILLIONS | SCALEFACTOR_QUADRILLIONS

Power of Inlines

Image
How to add the looping element in same line - horizontally ? use @inlines command,in conjunction with for-each. Here is the sample on how to do.

subtemplating

Image
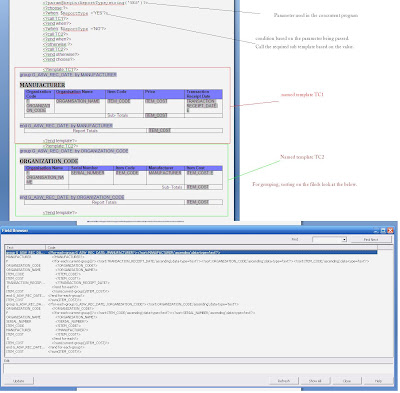
Have a look at this, just adding sub template and calling them based on the concurrent program parameter. <?param@begin:ReportType;string(‘YS’)?> <?choose:?> <?when: $ReportType =’YES’?> <?call:TC1?> <?end when?> <?when: $ReportType =’NO’?> <?call:TC2?> <?end when?> <?otherwise:?> <?call:TC2?> <?end otherwise?> <?end choose?> Run with ReportType as NO or other than YES. You should get the result as follows Run with ReportType YES. You should get the result as follows

Avery label Print Template

Image
How to create label using Avery template ? Here it is use the following xml <Root> <Row> <Code>001</Code> <Part>100</Part> <Id>01</Id> <Supplier>K0G</Supplier> </Row> <Row> <Code>002</Code> <Part>100</Part> <Id>01</Id> <Supplier>K0G</Supplier> </Row> <Row> <Code>003</Code> <Part>100</Part> <Id>01</Id> <Supplier>K0G</Supplier> </Row> <Row> <Code>004</Code> <Part>100</Part> <Id>01</Id> <Supplier>K0G</Supplier> </Row> <Row> <Code>005</Code> <Part>100</Part> <Id>01</Id> <Supplier>K0G</Supplier> </Row> <Row> <Code>006</Code> <Part>100</Part> <Id>01</Id> <Supplier>K0G</Supplier> </Row> <Row> <Code>007</Code> <Pa...

Cross tab Summation in RTF

Image
Crosstab report. It can be done in many ways, ideally people love to take some granular level data and manipulate and apply that in different template. Advantage of granular level data : We can use it for some other RTF template. We can show that the way we need to. If you pre-group, then your report will be faster. But you use the flex of using the same data for showing it different layout. since you pre-grouped it, its fixed data for some layout. You use this flex here. its a trade off on flex or performance, i choose go on the balanced line of these two. Forums thread with issue 1. it should be pretty simple in BIP template too. 2. have a look the thread link , i answered how to do it in Datatemplate. 3. Db rollup is also good option but for the answer at OPTION 1 look at this picture.

Summation of deficit data 2

Image
Again poped up, You have to use this, since you have data deficit in xml. <?xdoxslt:div(sum(current-group()[Interchange_Qual_Desc='BEST-QUAL']/Interchange_Qual_Count),/ROOT/LIST_Interchange_Tran_mc/Interchange_Tran_mc/Interchange_Tran_Count_Per_mc) * 100?> change the value, BEST, MID and NON for the three columns respectively. For the total, again <?xdoxslt:div(sum(/ROOT/LIST_Interchange_Qualilfication_Summary/Interchange_Qualilfication_Summary[Interchange_Qual_Desc='MID-QUAL']/Interchange_Qual_Count),(/ROOT/LIST_Interchange_Tran_v/Interchange_Tran_v/Interchange_Tran_Count_Per_v + /ROOT/LIST_Interchange_Tran_mc/Interchange_Tran_mc/Interchange_Tran_Count_Per_mc)) * 100?>

Summation of deficit data

Image
Request was, how to display the data when the value is not present in xml data. Just add the fixed number of description as rows and calculate respective total

Delimiter based E-text

Image
How to generate csv from Bi Publisher ? Have a look at this

Custom Dynamic sort in Bi Publisher

Image
Issue faced by someone on forum The data source can't be changed. You got the data as xml, and you want to specify the data sorting. Not in alphabetical order or numerical order, some arbitrary sort on particular column. We are make use of sort and decode and convert the element into number and get in sorted order. Looks possible and simple, but, one big hurdle over there, cannot use xsl 2.0, have to keep it simple. Here comes the handy "boolean to number conversion". We can make use of this here. Have a look at the snapshot. Look at the xml, status field is unsorted there. Expected output as follows. Status: Open Status: Unresolveable Status: Closed <?sort: (number(status='Open') * 1) + (number(status='Unresolveable') * 2) + (number(status='Closed') * 3);'ascending';data-type='number'?> Use the above sort.

Column Formatting

Image
We need formatting like * negatives values enclosed in () * Red color for negative values * format the number if not null How to do. Have a look at the syntax <?attribute@incontext:color;'red'?> <?attribute@incontext:font-weight;'bold'?> that's it, fantastic, you will see values in red and bold , with bracket. Other times, you might want to add border based on condition. here it is <?if@row:ELEMENT_NAME='SOME_CONDITION'?> <?attribute@incontext:border-top-color;'black'?> <?attribute@incontext:border-top-style;'solid'?> <?attribute@incontext:border-top-width;'thin?> <?attribute@incontext:text-align;'center'?> <?end if?> How to underline the text. <fo:inline text-decoration="underline"> <?YOUR_NUMBER_ELEMENT?> </fo:inline> This syntax is going to help you
In the pie chart, i want to limit the number format for each slice label. Here is what , we have to tweak it. Right click the picture , ->select format picture and go to alt text tab. paste this in between the graph element but, not at the end or beginning. <SliceLabel visible="true"> <ViewFormat decimalDigit="1" decimalSeparator="." decimalDigitUsed="true" decimalSeparatorUsed="true"/> </SliceLabel> This is where, its documented. Another issue logged there, Can you Hide the row, if the certain element is null or particular value ? Solved many times, but popping up again Use of @inlines is going to help us here. <?if:B_ADDRESS1!=''?><?B_ADDRESS1?><?end if?> <?if:B_ADDRESS1!='' and B_ADDRESS1!='null' and B_ADDRESS1!='NULL'?><?B_ADDRESS1?><?end if?> <?if@inlines:B_ADDRESS1!='' and B_ADDRESS1!='null' and B_ADDRESS1!='NULL'?...

Cross tab, by limiting the number of colums

Image
Cross-tab is the report, when the number of columns are unknown. But if the columns exceeds the page, the rest of the columns are moved to next page, by default. Horizontal-table-break command will be helpful here to repeat the number of columns to the next page. But if we want to control the number of columns that is displayed and if it exceeds the certain number, then the table has to be created in the same page from the columns where it left. In case there are 6 columns going accross (columns going accross are dynamic...). the first 5 columns should be displayed in one table and next 1 in another table below the first table In case of there are 16 columns going across.. 1st five columns in first table, 2nd five columns in 2nd table below the first table, 3rd five columns in third table below the 2nd table and remaining one column in the fourth table below the 3rd table is it possible ? Yes it is possible :) Here it is.

BIP Log - enable debug

You can enable the log. Go to JDK/jre/lib directory. 1. Create a file named xdodebug.cfg file with the following content: LogLevel=STATEMENT LogDir=[full path]/temp 2. Restart the BIP server. In the above temp folder xdo.log file will be created, you can get all info there Once your debugging is done, remove the file or rename the file to something else and restart the server. There are some enhancements above this in latest releases. if you cannot do the above steps for some reason, then we can go for those steps.

BIP Documentation

1. go through some of the samples provided in the desktop version. 2. Link 1 3. Link 2 4. Link 3 5. Clustering Link 4 6. Link 5 7. Link 6 8. ebiz Link 7 9. Functions Link 8 10. Offical Forums which can show the light, when it is dark 11. Datatemplate 11. Func Samples

Clustering

http://www.oracle.com/technology/products/xml-publisher/docs/BIP_HA.pdf http://m-button.blogspot.com/2009/04/how-to-create-distributed-weblogic.html

Configure Concurrent Reports to be run

In BI Publisher Standalone, How many concurrent reports can be run ? By default, it is set to 3. in-order to change it to 'N'. following change is required. 1. Go to Admin/Scheduler/quartz-config.properties 2. identify the line org.quartz.threadPool.threadCount=N 3. Change this to N, in order to concurrent no of reports to be run at a time.

Notes to look at

Sorting on Formatted Date

Image
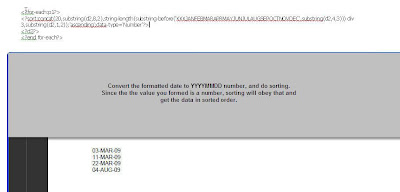
sort:concat(substring(d2,8,2),string-length(substring-before('XXXJANFEBMARAPRMAYJUNJULAUGSEPOCTNOVDEC',substring(d2,4,3))) div 3,substring(d2,1,2));'ascending';data-type='Number'

No data found

Image
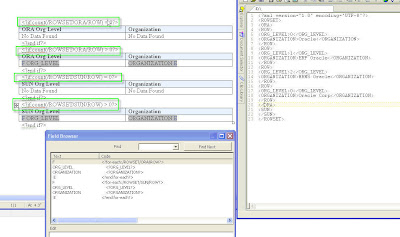
No data found, dynamically based on the data in xml. here is the sample , if you have row, show the data in table. use count() function to identify whether the row exists or not. I just used this this function, but you can very well use any expression to evaluate this condition to be true.

Api's

http://download.oracle.com/docs/cd/E12844_01/doc/bip.1013/e12693/toc.htm http://download.oracle.com/docs/cd/E12844_01/doc/bip.1013/e12188/T421739T517850.htm

Oracle Bi Publisher Plugin word 2007

Image
To validate the Oracle BI Publisher Plugin in Word 2007. If you are upgrading from the older version of Word to Latest 2007 +, then you got to clean up and install.

delete files older than x days

$ find /path/to/folder/*.file -mtime +1 -exec rm -f {} \; 1. Find all the files in the given path 2. -mtime, specifies the number of days old than today. +1, tells files older than 1 day. 3. -exec, executes the given command like "rm -f" 4. {} \; , ends the command

Hyperion driver to connect to MS Sql server.

Image
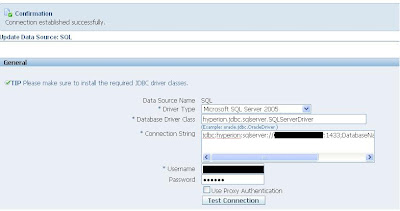
Using Hyperion driver to connect to Microsoft SQL server's for BI Publisher. Database Types like Microsoft SQL Server 2000 or Microsoft SQL Server 2005 Connection String = jdbc:hyperion:sqlserver://SERVERNAME:PORT;DatabaseName=DBNAME; Driver class = hyperion.jdbc.sqlserver.SQLServerDriver Once you click test connect , there you go!... Note : Microsoft SQL Server should be set up with mixed mode authentication.

Multiple copy

Image
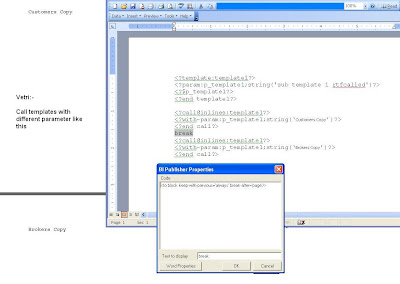
In Bi publisher, to get the multiple copy , we can use the @section and xdoxslt:foreach_number to get the multiple copy, which i discussed long back. we can do with other options too. here is the other one. Create sub-template and then call them with different parameter. this will call the sub template twice, so the xml will be parsed twice.

Data across in Bi publisher

Image
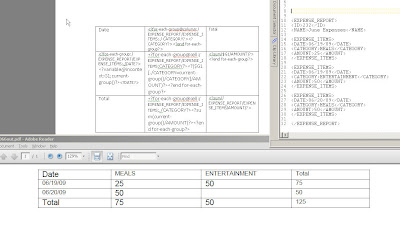
To get the cross tab. 1. we need to find the number of columns to be displayed. 2. what is the element to be mapped as column ? 3. then create a table. 4. the first row of the table , we need to specify the colum heading. so use the @column command 5. then in the rest of the row where you wanted to display the value , use @cell command

Apex Upgrade

You would already have a directory structure similar to Default created folder for XE installation c:\oraclexe\app (created by the Oracle XE installation) c:\oraclexe\oradata (created by the Oracle XE installation) Create a folder called apex. c:\oraclexe\apex Download and unzip the latest Apex to the folder apex under Oraclexe Step 1 Open DOS CMD window and change default to the directory of the unzipped Apex kit. e.g. CMD> cd c:\oraclexe\apex Step 2 - Upgrade to Version 3.1 CMD> sqlplus system/password as sysdba SQL> @apexins SYSAUX SYSAUX TEMP /i/ Step 3 - Set images directory CMD> sqlplus system/password as sysdba SQL> @apxldimg.sql c:\oraclexe Step 4 - Set Admin password SQL> @apxxepwd.sql password Step 5 - Enable remote http connections SQL> exec dbms_xdb.setListenerLocalAccess (l_access => FALSE); Login URL: http://127.0.0.1:8080/apex Workspace: Internal Username: Admin Password: password

Hide column from the crosstab report

In crosstab or dynamic column report , we typically do the following. <?for-each-group@column:ROW;./FISCAL_YEAR?> If i have to filter out particular value from being generated from the dynamic columns or crosstab report. <?for-each-group@column:ROW[./FISCAL_YEAR !='2000'];./FISCAL_YEAR?>

JVM Version on Oracle Database

Get JVM Property CREATE OR REPLACE FUNCTION getJava_property ( jProperty IN VARCHAR2) RETURN VARCHAR2 IS LANGUAGE JAVA name 'java.lang.System.getProperty(java.lang.String) return java.lang.String'; SELECT getjava_property('java.version') FROM dual;

Sum of Row and Col

Image
How to sum up , row and column in the template ?

Section - how to handle blank

Image
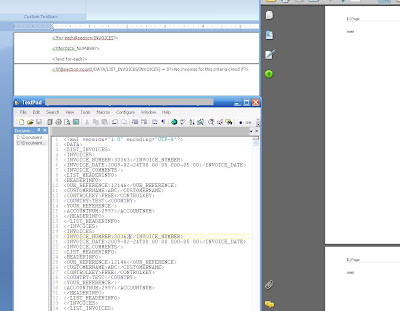
How to handle blank page, if no data in the xml.. Put a section break and add the code like following <?if@section:count(/DATA/LIST_INVOICES/INVOICES) = 0?>No invoices for this criteria<?end if?> You can handle the no data found like this.

Crosstab issue

Image
http://forums.oracle.com/forums/thread.jspa?messageID=3344649 In order to get the all months,the for-each should have been put on the whole xml, rather than , the current group. the current group might be missing some month value in the xml.

Chart : Different color based on cell value

Image
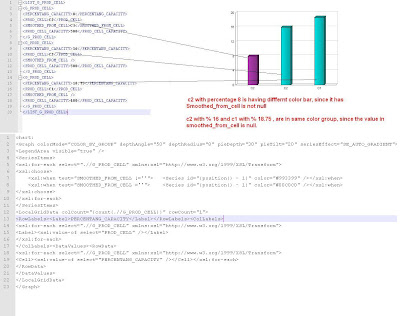
http://forums.oracle.com/forums/thread.jspa?messageID=3343920 http://forums.oracle.com/forums/thread.jspa?threadID=871513 This is little tricky, but do able.

Huge data

http://forums.oracle.com/forums/thread.jspa?messageID=1248093&#1248093 The XSLT engine we have is scalable ie it can handle umlimited XML input. Biggest we have gone to so far is ~6Gb of data (3million records) which generated ~100K pages in a just under an hour. Thats a rough guide for large docs, for through put we hava a customer pushing thru 20,000 docs per hour (4-10 pages) on a 4 CPU box using ~10% of CPU resources at peak. So were scalable and fast .... this is all configurable and its going to require you to work out a balance between and resources.

Pipelined functions in BIP

http://forums.oracle.com/forums/thread.jspa?messageID=2820319&#2820319 Wanted to use the pl/sql package in datatemplate ? Yes, we can use them in different ways, by using the oracle table function or Pipelined Table Functions. Pl/sql package will return the collection variable , which you can cast it as table in the query.. sample create type numset_t as table of number; / create function f1(x number) return numset_t pipelined is begin for i in 1..x loop pipe row(i); end loop; return; end; / select * from table(f1(3)); COLUMN_VALUE 1 2 3 In the datatemplate , you can just call the select * from table(f1(3)); Or even the parameter can be passed to the function, in which your entire logic can be written, which will return the collection variable. Datatemplate wil be more powerful , when used like this,

Inlines.

How to get the values in the loop in same line. <?for-each:xdoxslt:foreach_number($_XDOCTX,1,3,1)?> <?position()?> <?end for-each?> the result is 1 2 3 Is there way to make the result look like this: 1 2 3 yes, it is. use inline context , to get this way <?for-each@inlines:xdoxslt:foreach_number($_XDOCTX,1,3,1)?> <?position()?> <?end for-each?>