Graph Chart DataMarker
How to enable the marker in chart ?
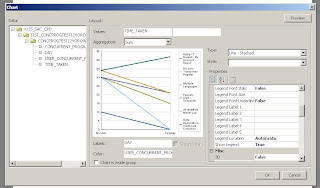
Especially like the one below ?
Xsl code for the chart has to be edited little bit, to make it visible, of course right now the BIP plugin , doesn't have this option in the front-end.
But in future , independent release , this is going to be there , like as it is in other reporting tools ;) like Oracle Reports...
Use this seriesitem
<SeriesItems lineWidth="100">
</SeriesItems>
And use Series id="0" for each series of colors used, and the mention the shape MS_SQUARE | MS_CIRCLE | MS_DIAMOND | MS_PLUS | MS_TRIANGLE_DOWN |MS_TRIANGLE_UP
to customize the size of marker
<DataMarker markerSize="40"/>
</p>
I used it as follows
<Series id="0" color="#FF8000" markerShape="MS_DIAMOND" />
<Series id="1" color="#0000C0" markerShape="MS_CIRCLE" />
<Series id="2" color="#008000" markerShape="MS_SQUARE" />
</SeriesItems>
Comments